










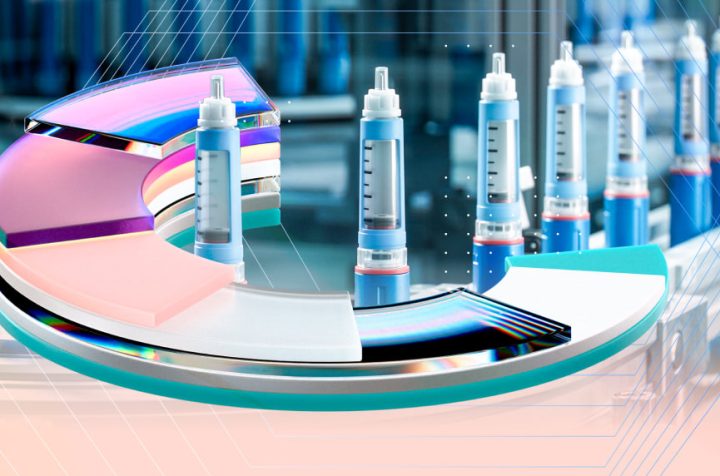
One of the most automated lines in the plant kept missing its targets. It filled a high-demand injectable device, the kind of vial-and-syringe line every site wants to run at full tilt, and it had modern equipment, experienced operators, and a maintenance team that knew every bolt on it. It still stopped without warning, scrapped more product than it should, and cycled through the same troubleshooting loop week after week without a lasting fix.
Operators pointed at the mechanics. Maintenance pointed at incoming material variability. IT pointed at the data systems. Nobody could prove their theory, because nobody could see the whole system at once. That gap, not a worn part or a bad batch of components, is the real story behind most underperforming aseptic fill and finish manufacturing lines.
Key takeaways
- It’s rarely the machine. Fill and finish underperformance usually comes from fragmented data across MES, ERP, PLCs, AGVs, and sensors, not a single faulty component.
- Consolidation makes causes visible. Aligning cross-system data in time and batch context turns invisible correlations into traceable root causes.
- PCA cuts the noise. Reducing hundreds of process variables to the few that actually drive performance is what makes prediction possible in the first place.
- Random Forest predicts the next stop. Trained on consolidated data, it flags likely failures before they happen, with no new equipment and no compromise to GMP.
- People matter more than algorithms. The payoff is sustained OEE gains and fewer unplanned stops, but only if the change is led on the floor, not just in the model.
What Is Aseptic Fill and Finish Manufacturing?

Aseptic fill and finish manufacturing is the final stage of pharmaceutical production, where a drug product is filled into its primary container, closed, inspected, and packaged under conditions designed to keep it sterile. It covers vials, cartridges, prefilled syringes, and pen devices, and it sits directly upstream of patient safety, regulatory approval, and product availability.
The process runs in four stages, each with its own precision requirements:
|
Stage |
What Happens |
Why It Matters |
|
Filling |
Product is dosed into vials, cartridges, syringes, or pens |
Extremely precise volumetric control; under- or over-fill is a batch-defining defect |
|
Closing |
Stoppering, crimping, or sealing |
Protects sterility and container integrity through shelf life |
|
Inspection |
Automated vision systems scan every unit |
Catches fill-level errors, particulates, and cosmetic defects before release |
|
Assembly & packaging |
Device build, labeling, serialization |
Final step before the batch is saleable; errors here trigger recalls |
In practice, teams use “aseptic filling,” “aseptic processing,” and “sterile fill finish” almost interchangeably, and the same fundamentals apply whether the product is a small molecule or a biologic (biologics fill finish carries the added complexity of protein stability and higher-viscosity formulations).
Because these lines run close to their technical limits, small inefficiencies compound fast. A one-percent drift in fill accuracy, a five-minute unplanned stop, a slightly out-of-spec seal: none of these looks dramatic in isolation, but stacked across a shift, they become the difference between hitting the production plan and missing it.
The Automation Paradox
It would be easy to assume that more automation means more predictability. The line at the center of this use case argues otherwise. It had multiple machines running in sequence, robotic handling, automated inspection, environmental controls, automated transport, and a full digital planning layer on top. Every one of those components did its job. None of them, on its own, could explain why the line kept stalling.
That is the paradox of modern pharmaceutical manufacturing software: each system is excellent at running its own piece of the process and nearly blind to everything around it. The PLC controlling the filling head doesn’t know that a pallet is stuck in the warehouse. The vision inspection system doesn’t know the room temperature drifted two degrees an hour ago. Each dataset, viewed alone, looks completely normal. The problem only becomes visible when you stop looking at the parts and start looking at the system.
Why a Modern Fill and Finish Line Is a Black Box
A fill and finish line generates data from six independent systems, each built to optimize its own function, not to explain line performance as a whole:
|
Data Source |
What It Reveals |
What Goes Wrong Without It |
|
Warehouse & material handling |
Material availability, lot changes, delivery timing |
Late deliveries starve the line and force stop-start behavior |
|
Environmental & temperature sensors |
Room temperature, humidity, seasonal drift |
Product viscosity and mechanical tolerances shift just enough to throw off alignment |
|
Machine PLCs |
Speed, torque, pressure, alarms, micro-stoppages |
Real operating behavior stays invisible until a full stop |
|
Automated transport (AGVs) |
Material movement timing, queue formation |
Queues back up and block equipment downstream |
|
Manufacturing Execution System (MES) |
Batch execution, step timing, deviations, operator actions |
Process execution can’t be linked to equipment behavior |
|
ERP |
Production schedules, demand signals, planning assumptions |
Changeover frequency and equipment stress go untracked |
The data problem compounds the technical one: information sits in silos, timestamps don’t align across systems, batch-level context is missing, and the correlations between all of the above stay invisible until someone builds the bridge between them. That bridge is what proper manufacturing data integration and MES-to-ERP data integration are actually for.
Data Consolidation, Not Just Another Dashboard
Data consolidation means collecting information from every operational system, aligning it in time, and structuring it around batches, equipment, and process steps, so fragmented records become one interpretable model of the line. It is not the same thing as adding another dashboard on top of the same siloed feeds.
Without consolidation, every dataset looks fine on its own, root causes stay hidden, and decisions default to assumptions and gut instinct. With it, cause-and-effect relationships surface, events can be traced across systems instead of guessed at, and the actual drivers of performance become something you can quantify rather than argue about in a meeting. This is the foundation BGO builds through GMP-validated systems and rigorous computer system validation (CSV): the compliance layer that lets consolidated data actually be trusted for decisions.
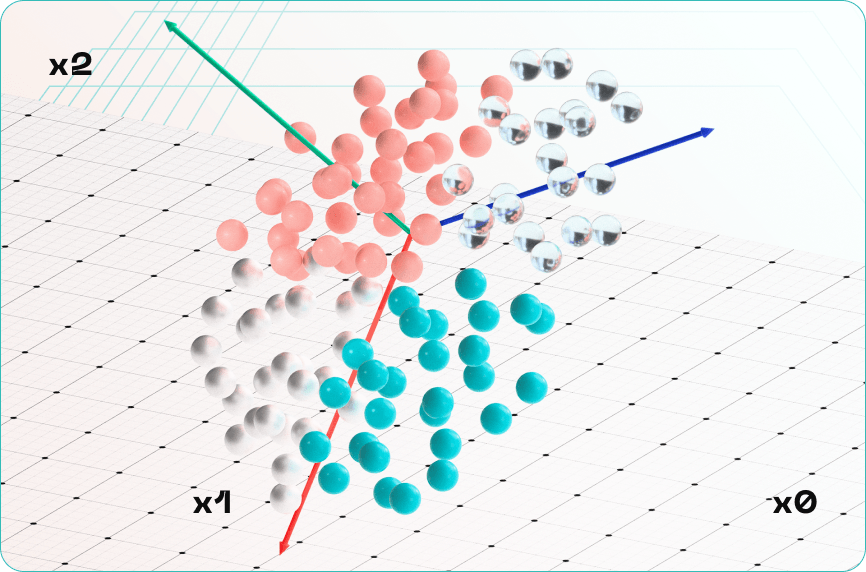
A single batch on a fill and finish line can generate hundreds of variables: machine parameters, environmental readings, timing signals, control states. Analyzing each one individually is not just impractical, it is actively misleading, because real performance drivers get buried under noise and redundant signals.
Principal Component Analysis (PCA) solves that by collapsing hundreds of variables into a small set of components that explain most of the variation in the data, filtering out the noise so teams can focus on genuine drivers instead of chasing coincidental correlations. This is not a theoretical fix. A published multivariate-monitoring workflow built specifically for formulation, fill, and finish processes used PCA with Hotelling’s T² statistics to reliably trace performance deviations back to their root cause (PubMed, PMID 32503165), and a 2022 review in Molecules on data fusion in process analytical technology confirms this kind of multivariate approach is now an accepted part of GMP-aligned, Pharma 4.0 process monitoring (PMC9369811).
Predicting the Stop Before It Happens: Why Random Forest
Traditional statistics are good at explaining what already happened. Preventing the next stop requires a model that can estimate what is about to happen, and that shift from descriptive to predictive analysis is what separates reactive troubleshooting from operational excellence.
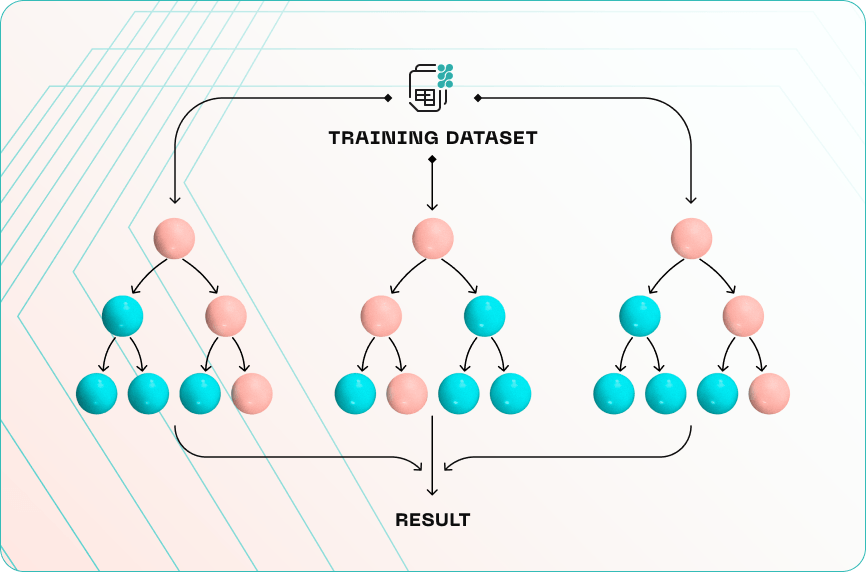
A Random Forest Regressor builds many decision trees, each learning slightly different patterns in the data, then averages their predictions into a single estimate. It handles non-linear relationships, tolerates noisy industrial signals, and captures interactions between variables that a simple linear model would miss entirely, which is exactly the profile of data a fill and finish line produces. The mechanism has real precedent outside pharma too: in a published tube-filling machine case study, a Random Forest model reached 88% prediction accuracy against 59% for linear regression, and three months after deployment the line’s OEE rose 13.10% while unplanned machine failures fell 62.38% (Natanael & Sutanto, Journal of Manufacturing and Materials Processing, 2022, DOI 10.3390/jmmp6050108). That is a filling line for a consumer product, not an aseptic pharma line, so treat it as proof that the method works, not as a pharma-specific benchmark.
Two methods, one pipeline:
|
Method |
Role |
Proof Point |
|
PCA |
Reduces hundreds of process variables to the few that actually drive performance |
Traced fill-finish deviations to root cause using Hotelling’s T² (PMID 32503165) |
|
Random Forest Regressor |
Predicts the next likely stop from the consolidated, PCA-filtered data |
88% prediction accuracy vs. 59% for linear regression; OEE +13.10%, unplanned failures -62.38% after 3 months (DOI 10.3390/jmmp6050108) |
What Is OEE, and How Do You Calculate It in Pharmaceutical Manufacturing?
Overall Equipment Effectiveness (OEE) measures how much of your planned production time actually converts into compliant, saleable product. It multiplies three factors:
|
Factor |
What It Measures |
|
Availability |
How much planned time the line actually runs |
|
Performance |
How close it runs to its designed speed |
|
Quality |
How much of what it produces meets specification |
Pharma OEE benchmarks vary by source and measurement method, but a consistent pattern holds across them:
|
Benchmark |
Typical OEE |
Note |
|
Average pharma line |
~35-48% |
Range across industry OEE benchmarking analyses |
|
Digitized, Pharma 4.0-aligned line |
~60% |
Same benchmarking analyses |
|
World-class pharma operation |
~70% |
Same benchmarking analyses |
|
Classic “world-class” threshold |
85% |
Seiichi Nakajima’s original TPM work in general manufacturing; rarely sustained in a regulated, validation-heavy pharma environment |
That gap between the 85% general-manufacturing benchmark and pharma’s realistic 60-70% ceiling is exactly why OEE improvement in this sector tends to come from visibility and prediction, not from simply running equipment harder.
Predictive Maintenance and AI: What It Actually Looks Like on the Floor
Predictive maintenance uses live operating data to estimate when a failure is likely, rather than servicing equipment on a fixed calendar regardless of its actual condition, which is the core distinction from preventive maintenance. AI adds the capacity to learn from far more signals, and far more history, than a person monitoring a control panel ever could.
By the numbers:
|
Metric |
Figure |
Source |
|
Unplanned downtime cost, industrial manufacturers |
~$50 billion/year |
Deloitte |
|
Uptime gain from predictive maintenance |
10-20% |
Deloitte |
|
Maintenance cost reduction from predictive maintenance |
5-10% |
Deloitte |
|
Top biopharma companies with predictive/autonomous manufacturing tools today |
28% |
Accenture, 2025 |
The opportunity is real and still largely untapped, and technology is only part of the equation. BCG’s research on scaling AI on the factory floor breaks the effort down plainly:
- 70% people and process change
- 20% data and technology backbone
- 10% the algorithms themselves
Sources: Deloitte, “Using AI in predictive maintenance to forecast the future”; Accenture, “Reinventing Biopharma: From Lab to Line”; BCG, “Shaking Up the Factory Floor with Digital and AI”.
What Changed on the Line
After the consolidated data model and AI-based monitoring went live, operators finally had visibility into how the line was expected to behave, not just what it was doing at that moment. Potential issues surfaced before they caused a stop. Environmental and time-of-day patterns that nobody had connected to performance turned out to be real contributors. Decision-making shifted from reacting to a stop to anticipating one.
The measured outcomes followed a consistent pattern:
- A material and sustained improvement in OEE
- A significant drop in unplanned stops
- A measurable reduction in daily human time spent firefighting
- Faster root cause identification when something did go wrong
That third point deserves a caveat: the FTE reduction reflects less manual troubleshooting and more time on higher-value work, not fewer people on the team. McKinsey’s broader research on biopharma manufacturing transformation backs the scale of what’s achievable here, documenting leading plants that captured 25 to 40% more capacity and cut deviations by 30 to 50% through similar data and analytics programs (McKinsey, “Reimagining the Future of Biopharma Manufacturing”).
The Bigger Point: This Was Never a Machine Problem
Fill and finish performance issues are rarely caused by one machine or one parameter. They are system-level problems created by line complexity, data fragmentation, and interactions that stay invisible until someone consolidates the data and applies the right analytics on top of it. Solving that does not require new equipment, and it does not require compromising GMP. It requires seeing the line as one system instead of six separate ones.
That shift also compounds over time. Stabilized performance and reduced variability show up almost immediately. Usable capacity and better production planning follow within a few quarters. And the longer-term payoff is a platform for continued process verification that scales across additional lines and sites, built on the same consolidated, validated foundation. BGO has built exactly this kind of manufacturing intelligence and continued process verification (CPV) system for pharmaceutical manufacturers navigating the same blind spots described here, and covered the broader shift toward AI-driven, connected manufacturing at the BGO Life Sciences & AI Forum.
If your own aseptic fill and finish line has a “we think it’s the material, or maybe the mechanics, or maybe the data” problem, that uncertainty is usually the actual signal worth investigating first.

Healthcare business analyst with expertise in marketing and business development, and holds an MPharm degree. He specialises in creating and executing communication strategies that make digital health solutions and pharmaceutical technologies clear, accessible, and resonation for their audiences.
link to the author’s linkedin profile